
Discord-based methods
Matrix Profile
Matrix Profile [Yeh et al. 2016, Zhu et al. 2016] is a discord-based method that represents time series as a matrix of closest neighbor distances. Compared to its predecessor, Matrix Profile proposed a new metadata time series computed effectively, capable of providing various valuable details about the examined time series, such as discords.
The MatrixProfile is computed using Mueen’s ultra-fast Algorithm for Similarity Search (MASS) [Mueen et al. 2017] that requires just O(nlog(n)) time by exploiting the Fast Fourier Transform (FFT) to calculate the dot products between the query and all the sub-sequences of the time series. Once these metadata are generated, retrieving the Top-k discord is possible by considering the maximum value of the Matrix Profile and ordering it, excluding the trivial matches (overlapping sub-sequences). Retrieving the sub-sequences with the shortest distance to their nearest neighbor (called motifs) is also possible. These sub-sequences correspond to a recurrent motif in the time series and can be useful in the anomaly search.
The TSB-UAD implementation of MatrixProfile is wrapper of Stumpy implementation.
- class TSB_UAD.models.matrix_profile.MatrixProfile(window)
Wrapper of the stympy implementation of the MatrixProfile algorithm
- Parameters
window (
int,) – target subsequence length.
- decision_scores_
The anomaly score. The higher, the more abnormal. Anomalies tend to have higher scores. This value is available once the detector is fitted.
- Type
numpy arrayofshape (n_samples - m,)
Example
import os
import numpy as np
import pandas as pd
from TSB_UAD.utils.visualisation import plotFig
from TSB_UAD.models.damp import DAMP
from TSB_UAD.models.feature import Window
from TSB_UAD.utils.slidingWindows import find_length
from TSB_UAD.vus.metrics import get_metrics
#Read data
filepath = 'PATH_TO_TSB_UAD/ECG/MBA_ECG805_data.out'
df = pd.read_csv(filepath, header=None).dropna().to_numpy()
name = filepath.split('/')[-1]
data = df[:,0].astype(float)
label = df[:,1].astype(int)
#Pre-processing
slidingWindow = find_length(data)
# Run MatrixProfile
modelName='MatrixProfile'
clf = MatrixProfile(window = slidingWindow)
clf.fit(data)
score = clf.decision_scores_
#Post-processing
score = MinMaxScaler(feature_range=(0,1)).fit_transform(score.reshape(-1,1)).ravel()
score = np.array([score[0]]*math.ceil((slidingWindow-1)/2) + list(score) + [score[-1]]*((slidingWindow-1)//2))
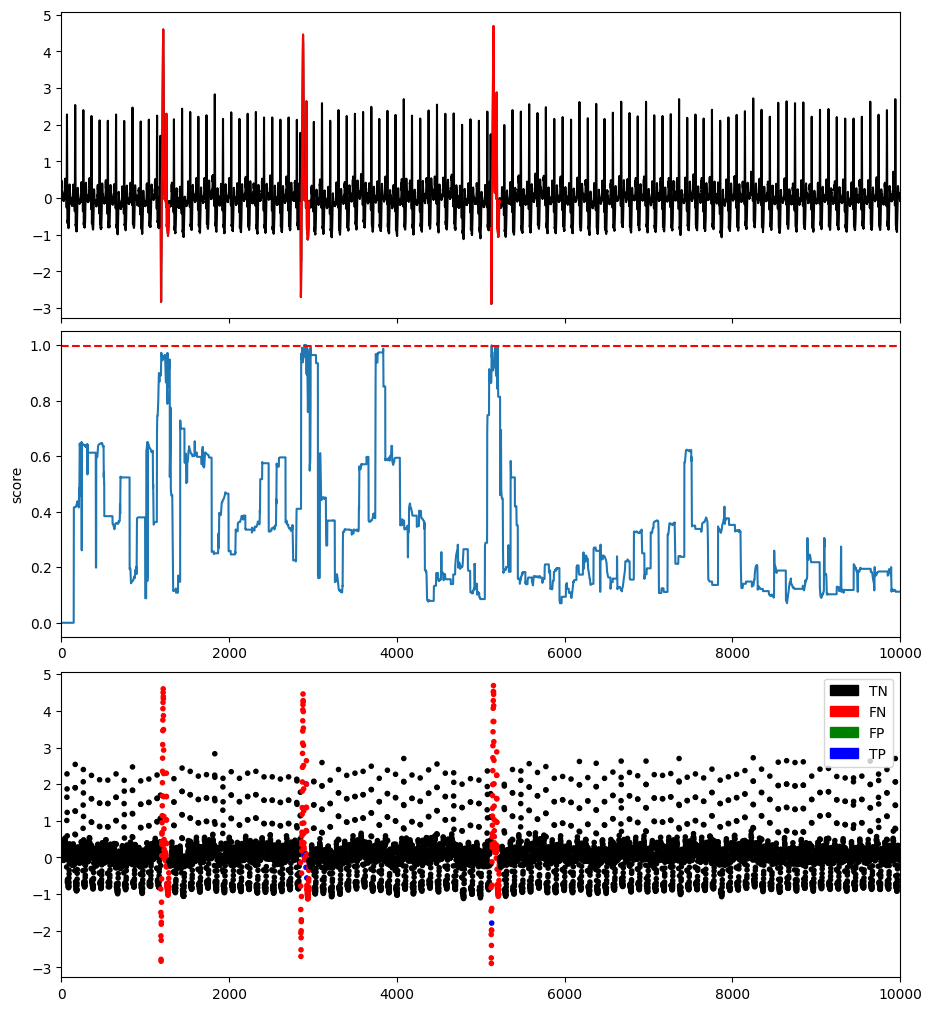
#Plot result
plotFig(data, label, score, slidingWindow, fileName=name, modelName=modelName)
#Print accuracy
results = get_metrics(score, label, metric="all", slidingWindow=slidingWindow)
for metric in results.keys():
print(metric, ':', results[metric])
AUC_ROC : 0.7968186887782313
AUC_PR : 0.09205761752802392
Precision : 0.058823529411764705
Recall : 0.0297029702970297
F : 0.039473684210526314
Precision_at_k : 0.0297029702970297
Rprecision : 0.125
Rrecall : 0.09090909090909093
RF : 0.10526315789473685
R_AUC_ROC : 0.9531611224056705
R_AUC_PR : 0.4926688922361494
VUS_ROC : 0.9186620929224953
VUS_PR : 0.39033909329157723
Affiliation_Precision : 0.9015749833720904
Affiliation_Recall : 0.9720951147963328

References
[Yeh et al. 2016] C. Yeh, Y. Zhu, L. Ulanova, N. Begum, Y. Ding, H. Dau, D. Silva, A. Mueen, and E. Keogh. 2016a. Matrix profile I: all pairs similarity joins for time series: A unifying view that includes motifs, discords and shapelets. In ICDM.
[Zhu et al. 2016] Y. Zhu, Z. Zimmerman, N. S. Senobari, C.-C. M. Yeh, G. Funning, A. Mueen, P. Brisk, and E. Keogh. 2016a. Matrix profile ii: Exploiting a novel algorithm and gpus to break the one hundred million barrier for time series motifs and joins. In 2016 IEEE 16th international conference on data mining (ICDM), pp. 739–748. IEEE.
[Mueen et al. 2017] A. Mueen, Y. Zhu, M. Yeh, K. Kamgar, K. Viswanathan, C. Gupta, and E. Keogh, August 2017. The fastest similarity search algorithm for time series subsequences under euclidean distance.
DAMP
DAMP [Lu et al. 2022] is a discord-based method, and scalable matrix Profile-based approach proposed to solves the problem of multiple similar anomalies. Moreover, is able to work on online settings, and scale to fast-arriving streams.
The TSB-UAD implementation of the DAMP algorithm follows the descripition in the original paper Lu et al. 2022. The TSB-UAD implementation is adapted from TimeEval.
- class TSB_UAD.models.damp.DAMP(m, sp_index, x_lag=None)
Implementation of the DAMP algorithm
- Parameters
- decision_scores_
The anomaly score. The higher, the more abnormal. Anomalies tend to have higher scores. This value is available once the detector is fitted.
- Type
numpy arrayofshape (n_samples - m,)
Example
import os
import numpy as np
import pandas as pd
from TSB_UAD.utils.visualisation import plotFig
from TSB_UAD.models.damp import DAMP
from TSB_UAD.models.feature import Window
from TSB_UAD.utils.slidingWindows import find_length
from TSB_UAD.vus.metrics import get_metrics

#Read data
filepath = 'PATH_TO_TSB_UAD/ECG/MBA_ECG805_data.out'
df = pd.read_csv(filepath, header=None).dropna().to_numpy()
name = filepath.split('/')[-1]

data = df[:,0].astype(float)
label = df[:,1].astype(int)

#Pre-processing
slidingWindow = find_length(data)

# Run DAMP
modelName='DAMP'
clf = DAMP(m = slidingWindow,sp_index=slidingWindow+1)
clf.fit(data)
score = clf.decision_scores_

#Post-processing
score = MinMaxScaler(feature_range=(0,1)).fit_transform(score.reshape(-1,1)).ravel()
score = np.array([score[0]]*math.ceil((slidingWindow-1)/2) + list(score) + [score[-1]]*((slidingWindow-1)//2))

#Plot result
plotFig(data, label, score, slidingWindow, fileName=name, modelName=modelName)

#Print accuracy
results = get_metrics(score, label, metric="all", slidingWindow=slidingWindow)
for metric in results.keys():
    print(metric, ':', results[metric])
AUC_ROC : 0.9796517653209067
AUC_PR : 0.5354674121425284
Precision : 1.0
Recall : 0.0462046204620462
F : 0.08832807570977919
Precision_at_k : 0.0462046204620462
Rprecision : 1.0
Rrecall : 0.1427450980392157
RF : 0.24982841455044613
R_AUC_ROC : 0.9861962693093778
R_AUC_PR : 0.6140113439366928
VUS_ROC : 0.9813282886141234
VUS_PR : 0.5943507237860649
Affiliation_Precision : 0.6162807136520358
Affiliation_Recall : 0.9999402806808003
References
[Lu et al. 2022] Y. Lu, R. Wu, A. Mueen, M. A. Zuluaga, and E. Keogh. 2022. Matrix profile xxiv: scaling time series anomaly detection to trillions of datapoints and ultra-fast arriving data streams. In SIGKDD, pp. 1173–1182.